|
SARNO
PLEASE USE OUR A-Z INDEX TO NAVIGATE THIS SITE |
|||||||||||||||||||||||||||||||||||||||||||||||||||||||||||||||||||||||||||||||||||||||||||||||||||||||||||||||||||||||||||||||||||||||||||||||||||||||||||||||||||||||||
SKY DECEMBER 2017 - According to the Helmholtz Centre for Environmental Research in Leipzig, the Yangtze was the worst offender, reference research published in the journal Environmental Science & Technology. This Chinese river carries up to 1.5 million tonnes of plastic into the sea every year. In contrast, the Thames in the UK puts 18 tonnes of plastic into the ocean.
The Sarno, known as Sarnus to the
Romans, is a stream that passes through Pompeii to the south of the
Italian city of Naples. It is considered the most polluted river in Europe. It flows about 24 kilometres (15 mi) from the base of Mt. Sarno to the Bay of Naples collecting water from the Solofrana and Cavaiola tributaries during the course of its flow.
The
pollution flows into the Mediterranean
Sea, contaminating the fish
that are then caught by local fishermen. Probably in contravention of
European health and safety legislation, and probably rendering carcinogenic,
the sardines
and other seafood products that are exported to the rest of the world. We
would suggest that the source of fish and the pollution levels of the
fishery where the catch originated, should be printed on seafood product
exports.
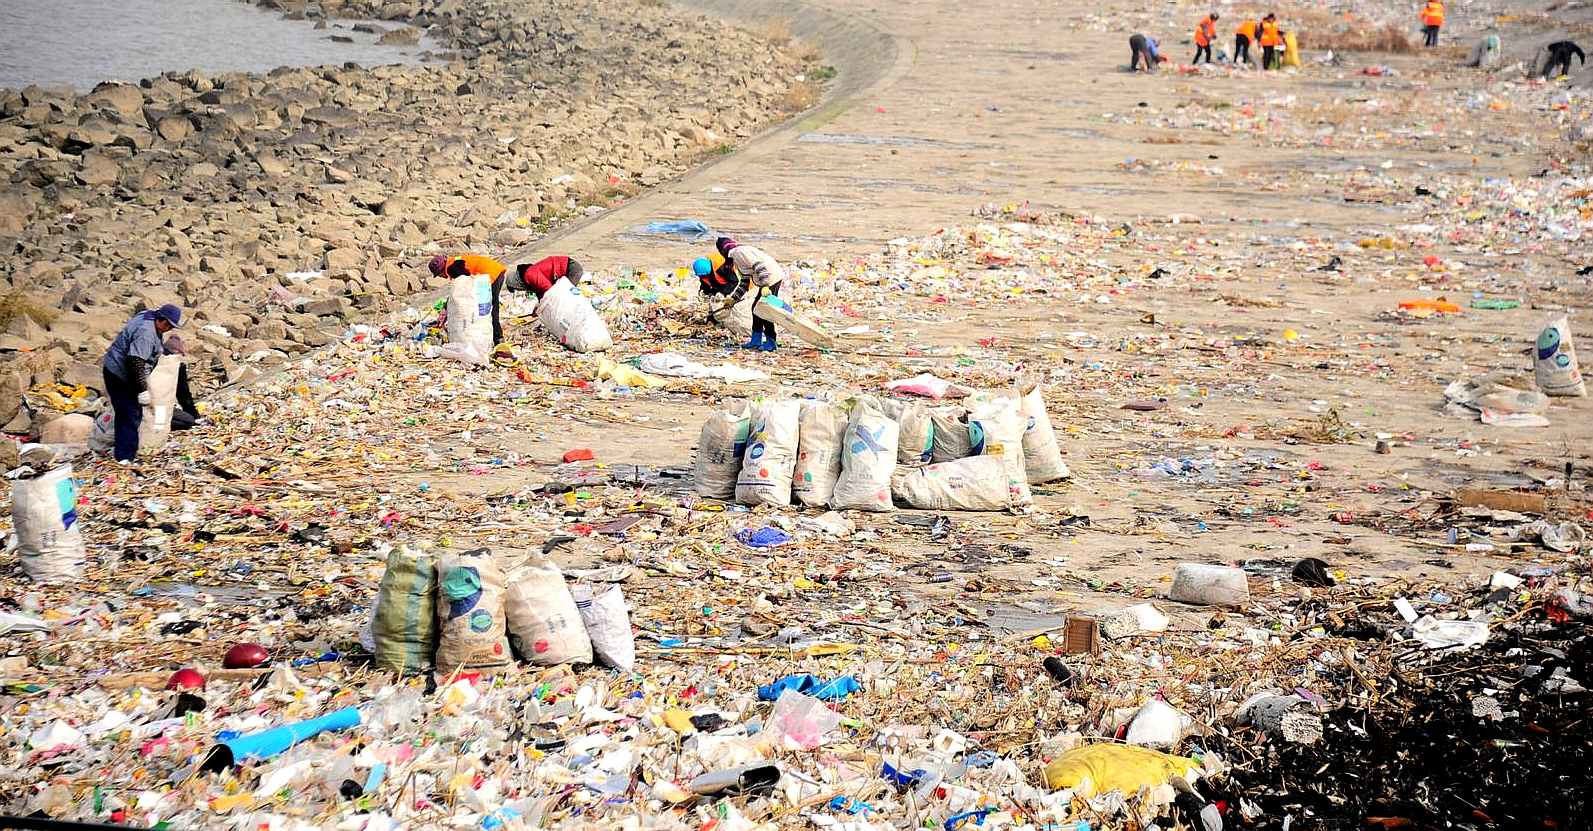
Around ninety percent (90%) of plastics in the ocean comes from just 10 rivers. Nine of these rivers are located in Asia and one of them borders Thailand.
The top 10 most polluted rivers in the world have one thing in common – they are located alongside large human populations with poor waste management (PWM) systems.
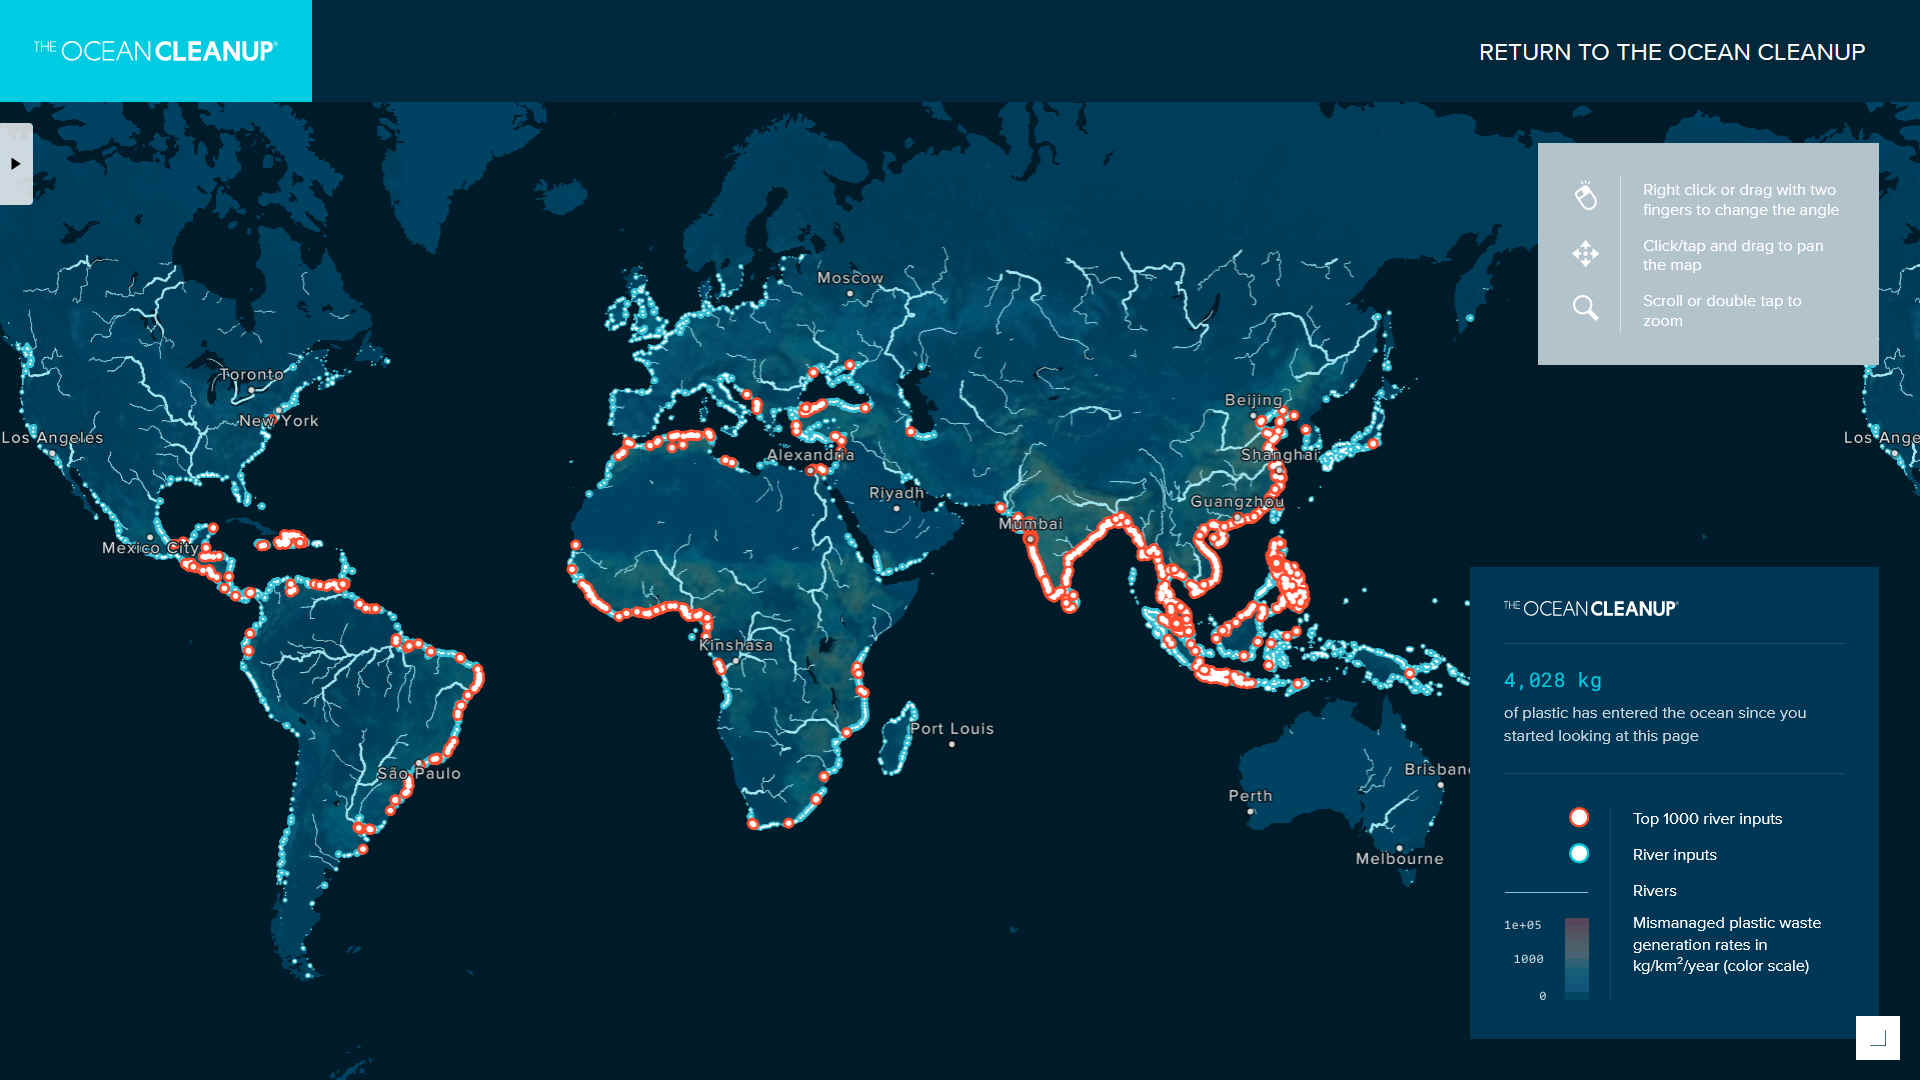
OCEAN CLEANUP - Rivers are a major source of plastic waste in the oceans. We estimate that 1000 rivers, represented by the red dots, are accountable for nearly 80% of global annual riverine plastic emissions, which range between 0.8 – 2.7 million metric tons per year, with small urban rivers amongst the most polluting. The remaining 20% of plastic emissions are distributed over 30,000 rivers, represented by smaller blue dots.
Every
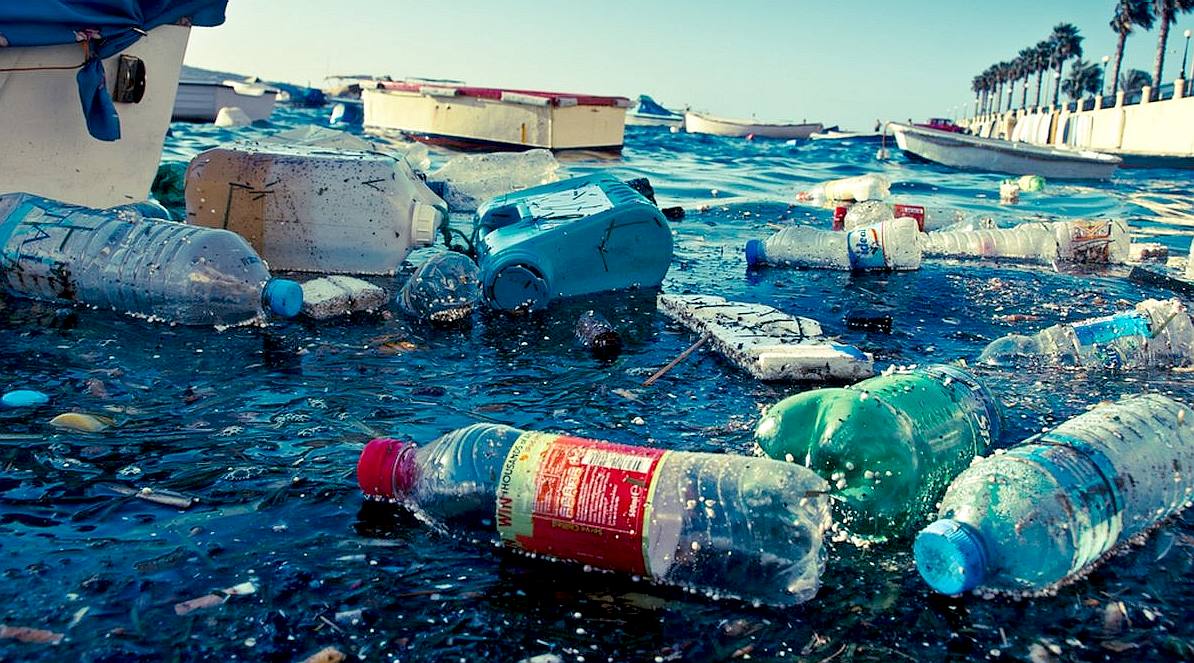
year the world, produces 300 million tonnes of plastics, and 8.8 million tonnes of these are dumped into the oceans. That’s about 40 billion plastic
bottles, 100 billion single-use plastic bags, and 522 million personal care items. If you know a seriously polluted river, or one that should be a candidate on a bigger list, please contact Cleaner Ocean Foundation.
The rivers noted, added to hundreds of other lesser contributors feed the five ocean gyres to poison marine life and cover the seabed in a mountain of plastic.
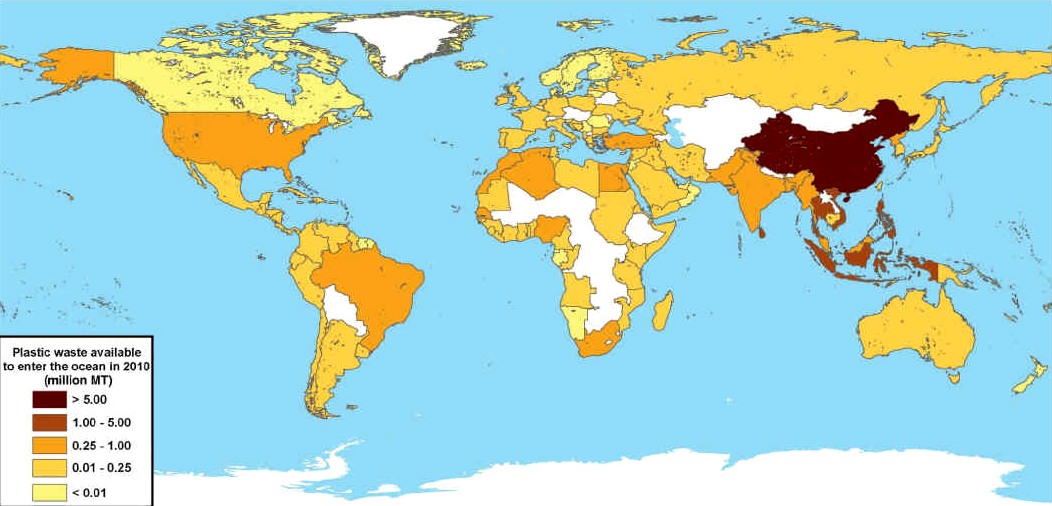
JAMBECK 2010 - Global map with each country shaded according to the estimated mass of mismanaged plastic waste [millions ofmetric tons (MT)] generated in 2010 by populations living within 50 km of the coast. 192 countries were considered. Countries not included in the study are shaded white.
LINKS & REFERENCE
https://
|
|||||||||||||||||||||||||||||||||||||||||||||||||||||||||||||||||||||||||||||||||||||||||||||||||||||||||||||||||||||||||||||||||||||||||||||||||||||||||||||||||||||||||
|
ABS - BIOMAGNIFICATION - CANCER - CARRIER BAGS - COTTON BUDS - DDT - FISHING NETS - HEAVY METALS - MARINE LITTER - MICROBEADS MICRO PLASTICS - NYLON - OCEAN GYRES - OCEAN WASTE - PACKAGING - PCBS - PET - PETROLEUM - PLASTIC - PLASTICS - POLYCARBONATE POLYOLEFINS - POLYPROPYLENE - POLYSTYRENE - POLYTHENE - POPS - PVC - SHOES - SINGLE USE - SOUP - STRAWS - WATER
AMAZON - AMUR - BRANTAS - BURIGANGA RIVER - CITARUM RIVER - CONGO - CROSS - DANUBE - DONG - CUYAHOGA - GANGA - GANGES - HAI HE -
HANJIANG - HUANGPU - IMO - INDUS - IRRAWADDY - IRTYSH - RIVER JORDAN - KWA IBO - LENA - MAGDELENA - RIVER MANTANZA-RIACHUELO
MARILAO - MEKONG - MISSISSIPPI RIVER - NIGER - THE RIVER NILE - PARANA - PASIG - PROGO - SARNO - SERAYU - SOLO - TAMSUI
THAMES - XI - YAMUNA - YANGTZE RIVER - YELLOW - ZHUJIANG PEARL
PLEASE USE OUR A-Z INDEX TO NAVIGATE THIS SITE
|
|||||||||||||||||||||||||||||||||||||||||||||||||||||||||||||||||||||||||||||||||||||||||||||||||||||||||||||||||||||||||||||||||||||||||||||||||||||||||||||||||||||||||
|
This website is provided on a free basis as a public information service. copyright © Cleaner Oceans Foundation Ltd (COFL) (Company No: 4674774) 2024. 24. Solar Studios, BN271RF, United Kingdom. COFL is a company without share capital.
|