|
MISSISSIPPI
PLEASE USE OUR A-Z INDEX TO NAVIGATE THIS SITE |
||||||||||||||||||||||||||||||||||||||||||||||||||||||||||||||||||||||||||||||||||||||||||||||||||||||||||||||||||||||||||||||||||||||||||||||||||||||||||||||||||||||||
SKY DECEMBER 2017 - According to the Helmholtz Centre for Environmental Research in Leipzig, the Yangtze was the worst offender, reference research published in the journal Environmental Science & Technology. This Chinese river carries up to 1.5 million tonnes of plastic into the sea every year. In contrast, the Thames in the UK puts 18 tonnes of plastic into the ocean.
The Mississippi is a giant slow moving river where agricultural runoff is one of the leading causes of water pollution much as with other rivers in the United States. Current agricultural practices lead to nutrient loading and in turn to eutrophication.
One of the main problems in attempts to regulate this type of pollution is that it is non-point source. The Clean Water Act (CWA) regulates both point source pollution directly and non-point source pollution through ambient water quality standards, yet regulating the latter is much more difficult and ineffective.
The Mississippi near Bemidji is the untainted river of our imagination. As it travels south of St. Cloud, however, the pollutants start pouring in, and by the time the historic waterway hits Minneapolis, the fish are often under consumption advisories and the water is sometimes unsafe for swimming.
It is not so much plastic as chemical dumping. Over 125 million pounds of toxics were released into waterways tributary to the Mississippi in 2010—more than half the total released in the entire United States.
Since one gallon of oil weighs about 7 pounds, by way of comparison,
a much reported solitary oil spill loosed 217,000 pounds of oil into the Mississippi. In other words, every year we dump approximately 576 times more toxic pollution into the Mississippi, and nobody cares.
MISSISSIPPI FACTS
The Mississippi River’s drainage basin covers parts of 31 US states and 2 provinces of Canada.
The Mississippi flows through or directly borders these states: Minnesota, Wisconsin, Iowa, Illinois, Missouri, Kentucky, Tennessee, Arkansas, Mississippi and Louisiana.
The Mississippi River is divided into three sections: Upper, Middle and Lower.
The Upper Mississippi flows through the state of Minnesota. Over 40 dams control the flow of the Upper Mississippi, and many of these dams include locks in order to help ships and boats navigate it.
The Middle Mississippi starts at the confluence (meeting) of the Mississippi and the Missouri River at St Louis, Missouri, and comes to an end at the Mississippi’s confluence with the Ohio River in Illinois.
The Lower Mississippi River has several tributaries, such as: The White River, the Arkansas River, the Big Black River and the Red River.
At several points the width of the Lower Mississippi River is greater than 1 mile.
For such a large river, the Mississippi has a relatively low flow. The Amazon River, for example, moves nearly 10 times as much water.
Around ninety percent (90%) of plastics in the ocean comes from just 10 rivers. Nine of these rivers are located in Asia and one of them borders Thailand.
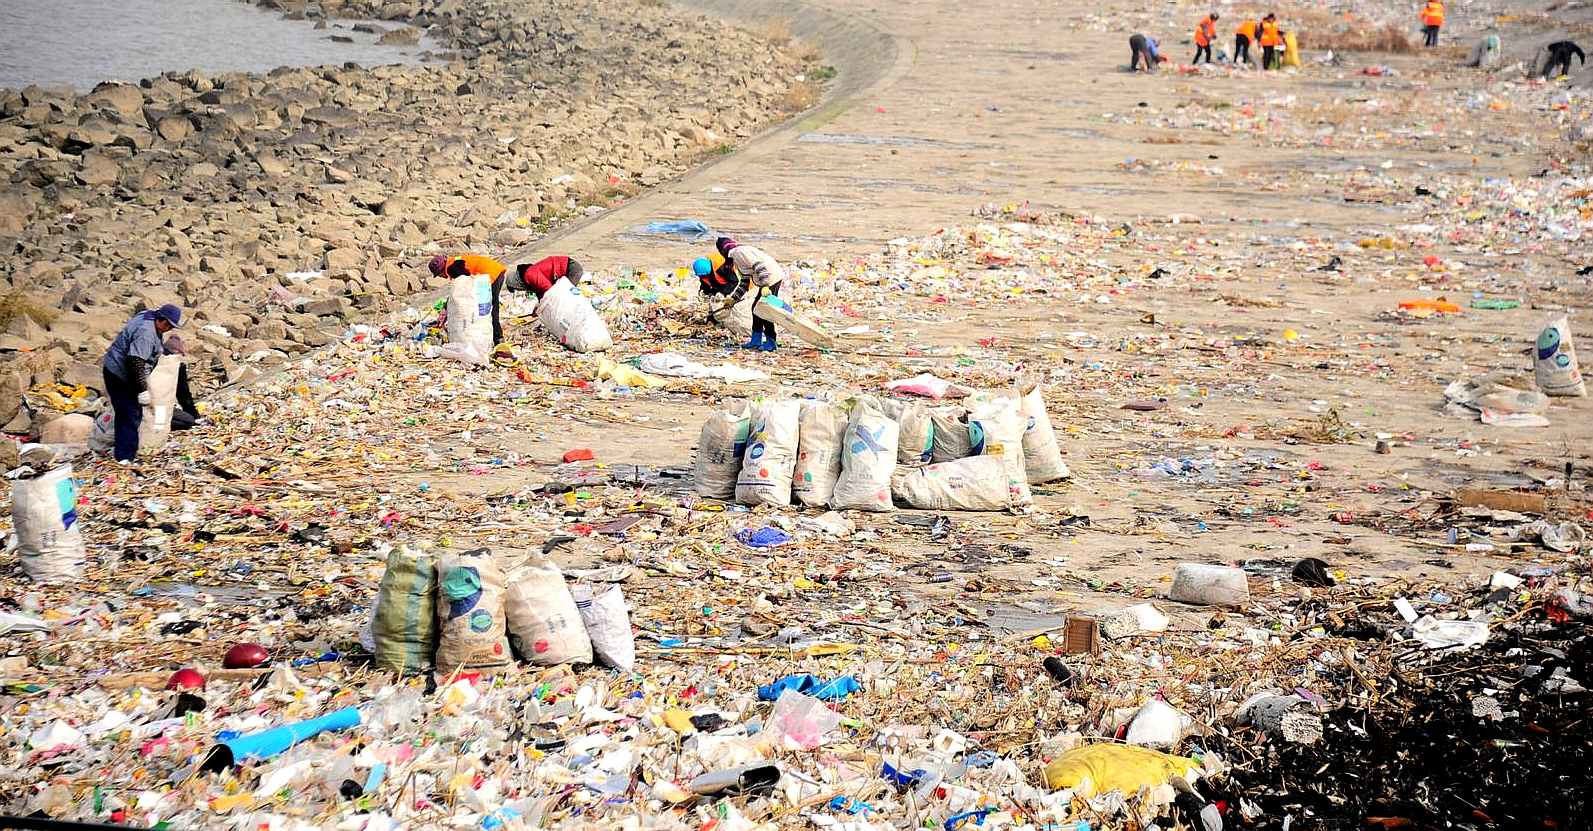
The top 10 most polluted rivers in the world have one thing in common – they are located alongside large human populations with poor waste management (PWM) systems.
...
Every
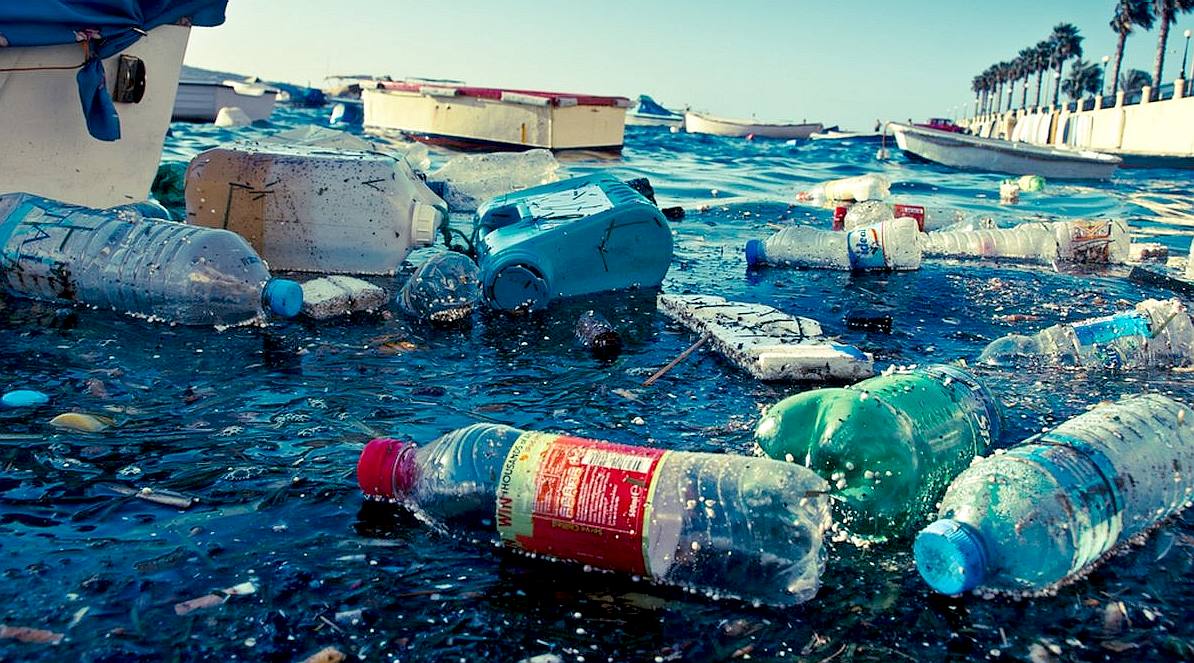
year the world, produces 300 million tonnes of plastics, and 8.8 million tonnes of these are dumped into the oceans. That’s about 40 billion plastic
bottles, 100 billion single-use plastic bags, and 522 million personal care items. If you know a seriously polluted river, or one that should be a candidate on a bigger list, please contact Cleaner Ocean Foundation.
The rivers noted, added to hundreds of other lesser contributors feed the five ocean gyres to poison marine life and cover the seabed in a mountain of plastic.
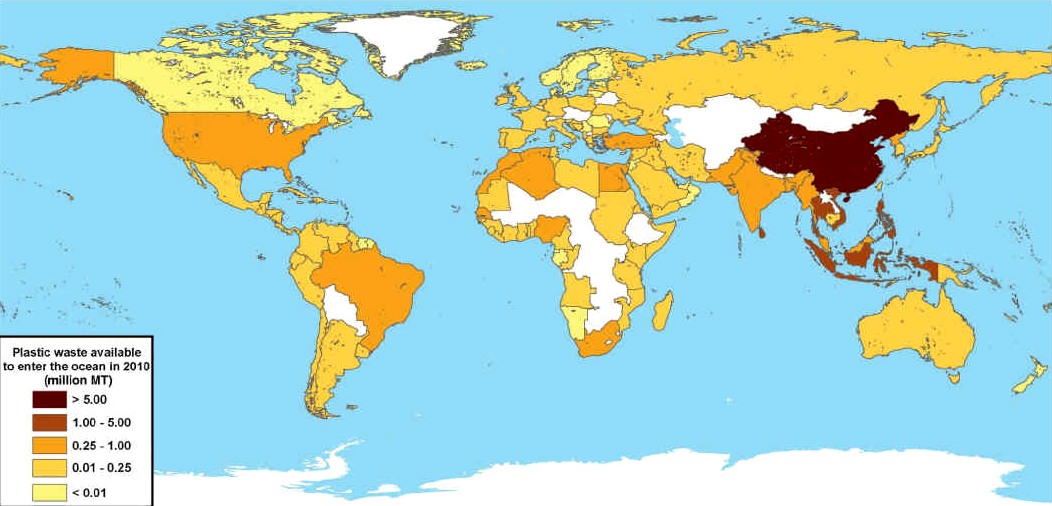
JAMBECK 2010 - Global map with each country shaded according to the estimated mass of mismanaged plastic waste [millions ofmetric tons (MT)] generated in 2010 by populations living within 50 km of the coast. 192 countries were considered. Countries not included in the study are shaded white.
LINKS & REFERENCE
https://
|
||||||||||||||||||||||||||||||||||||||||||||||||||||||||||||||||||||||||||||||||||||||||||||||||||||||||||||||||||||||||||||||||||||||||||||||||||||||||||||||||||||||||
|
ABS - BIOMAGNIFICATION - CANCER - CARRIER BAGS - COTTON BUDS - DDT - FISHING NETS - HEAVY METALS - MARINE LITTER - MICROBEADS MICRO PLASTICS - NYLON - OCEAN GYRES - OCEAN WASTE - PACKAGING - PCBS - PET - PETROLEUM - PLASTIC - PLASTICS - POLYCARBONATE POLYOLEFINS - POLYPROPYLENE - POLYSTYRENE - POLYTHENE - POPS - PVC - SHOES - SINGLE USE - SOUP - STRAWS - WATER
AMAZON - AMUR - BRANTAS - BURIGANGA RIVER - CITARUM RIVER - CONGO - CROSS - DANUBE - DONG - CUYAHOGA - GANGA - GANGES - HAI HE -
HANJIANG - HUANGPU - IMO - INDUS - IRRAWADDY - IRTYSH - RIVER JORDAN - KWA IBO - LENA - MAGDELENA - RIVER MANTANZA-RIACHUELO
MARILAO - MEKONG - MISSISSIPPI RIVER - NIGER - THE RIVER NILE - PARANA - PASIG - PROGO - SARNO - SERAYU - SOLO - TAMSUI
THAMES - XI - YAMUNA - YANGTZE RIVER - YELLOW - ZHUJIANG PEARL
PLEASE USE OUR A-Z INDEX TO NAVIGATE THIS SITE
|
||||||||||||||||||||||||||||||||||||||||||||||||||||||||||||||||||||||||||||||||||||||||||||||||||||||||||||||||||||||||||||||||||||||||||||||||||||||||||||||||||||||||
|
This website is provided on a free basis as a public information service. copyright © Cleaner Oceans Foundation Ltd (COFL) (Company No: 4674774) 2024. Solar Studios, BN271RF, United Kingdom. COFL is a company without share capital.
|