|
STARVATION
& DEATH
PLEASE USE OUR A-Z INDEX
TO NAVIGATE THIS SITE
The
security of food for humans
living on planet
earth depends on the quality of agricultural
land and the health of our oceans.
Good
quality farm land is reducing because of desertification
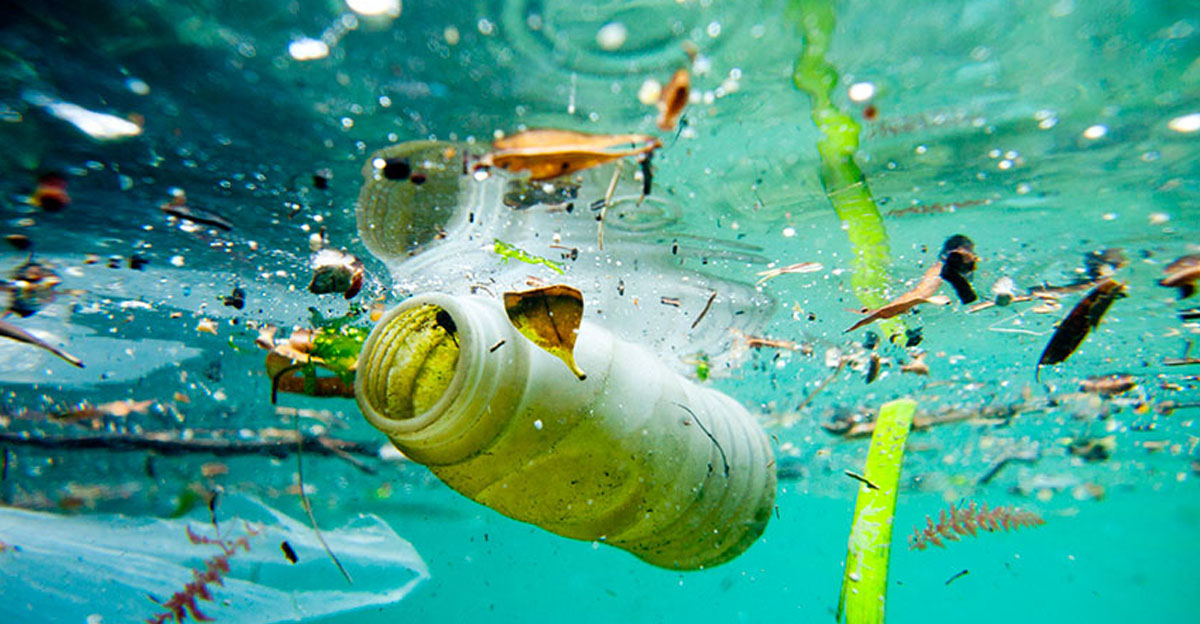
and our oceans are subject to plastic and other marine
pollution. Both of these problems are the subjects of the
various Conferences
of the Parties to United
Nations conventions.
Regardless
of these conferences over many years, marine pollution has
worsened with toxic plastics now threatening the safety of fish
as a reliable food source, as compared to the risk of cancer
from an increase in the consumption of carcinogens.
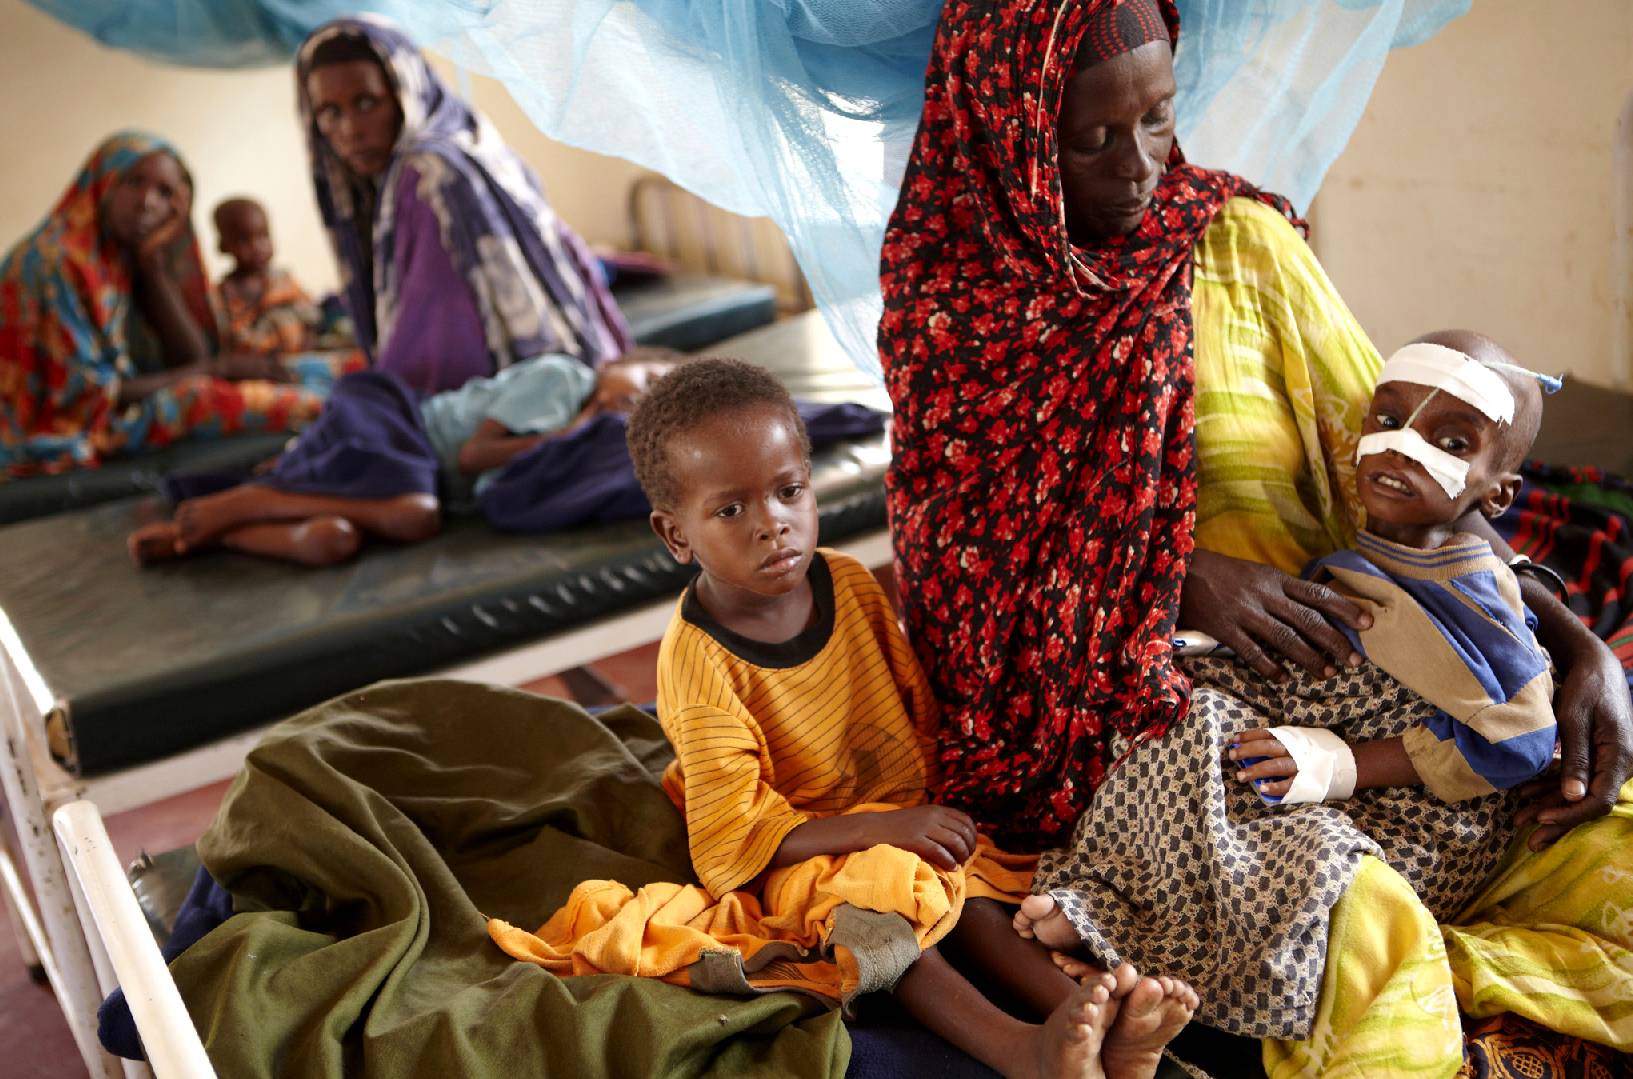
MALNUTRITION
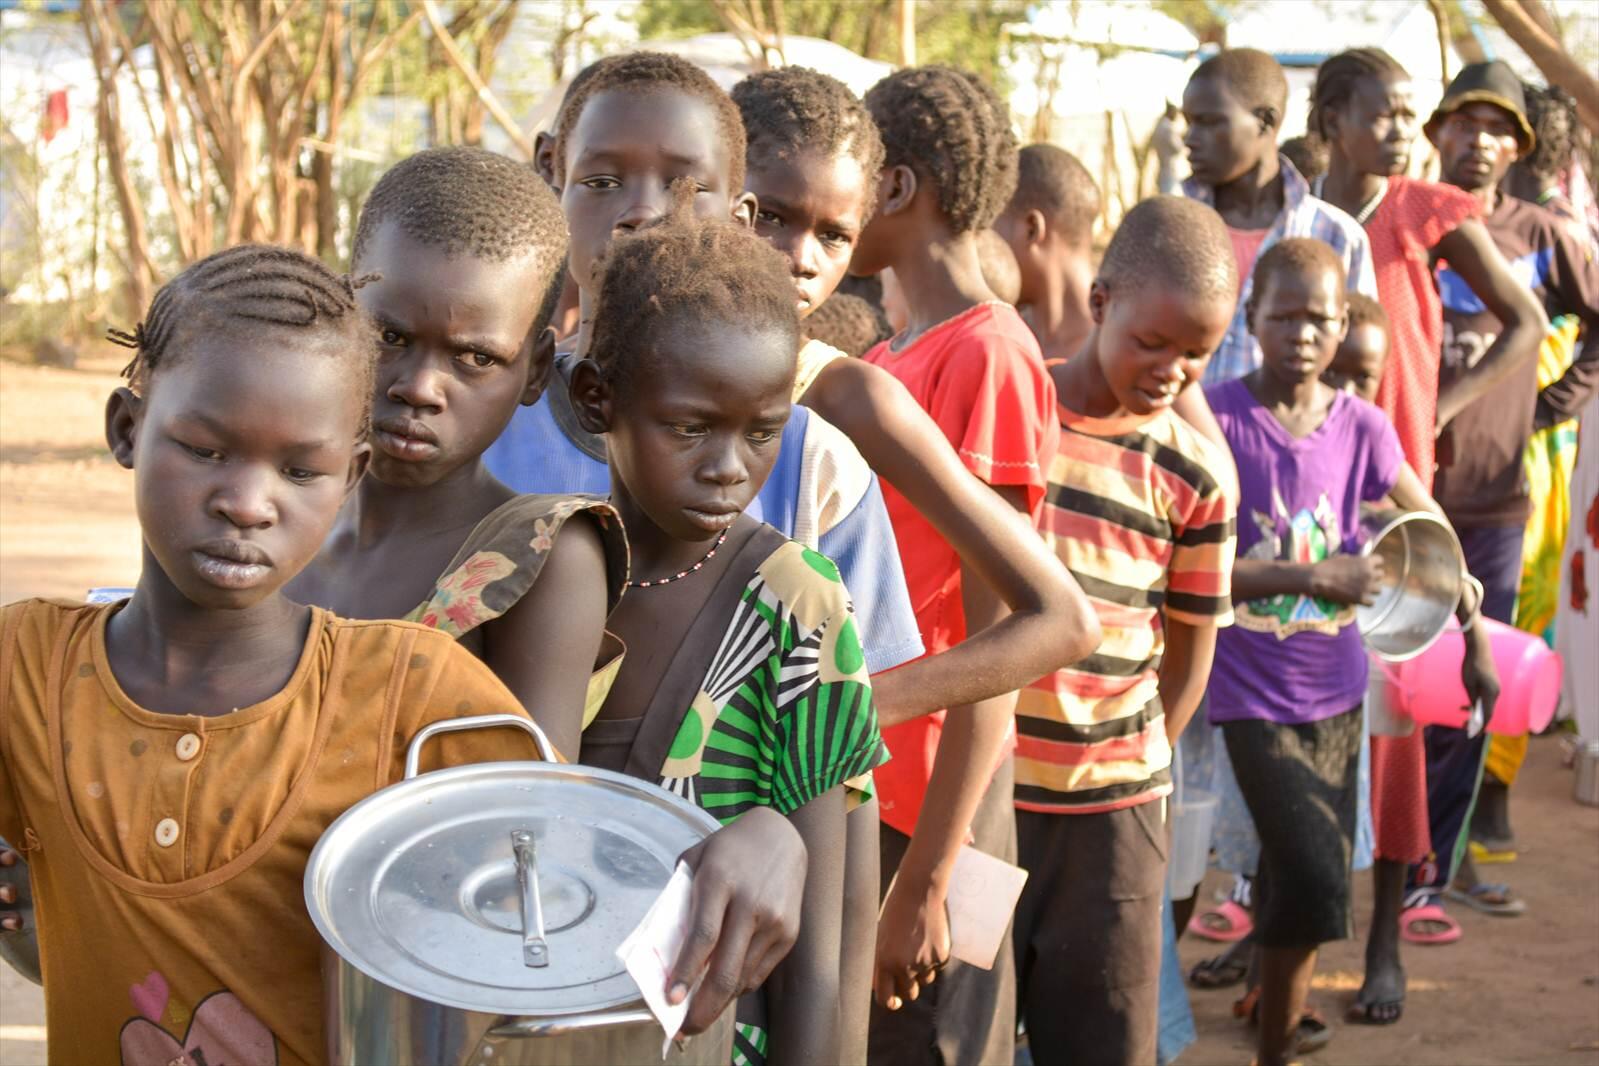
Undernourishment is most often due to not enough high-quality food being available to eat. This is often related to high food prices and poverty.
According to the World Health
Organization, hunger is the single gravest threat to the world's public health. Undernutrition is a contributory factor in the death of 3.1 million children under five every year. The demographic impacts of famine are sharp. Mortality is concentrated among children and the elderly.
A famine is a widespread scarcity of food, caused by several factors including war, inflation, crop failure, population imbalance, or government policies.
Many organizations have been highly effective at reducing starvation in different regions. Aid agencies give direct assistance to individuals, while political organizations pressure political leaders to enact more macro-scale policies that will reduce famine and provide aid.
According to estimates by the Food and Agriculture Organization there were 925 million under- or malnourished people in the world in 2010. This was a decrease from an estimate of roughly 1 billion malnourished people in 2009. In 2007, 923 million people were reported as being undernourished, an increase of 80 million since 1990-92. It has also been recorded that the world already produces enough food to support the
world's
population.
As the definitions of starving and malnourished people are different, the number of starving people is different from that of malnourished. Generally, far fewer people are starving, than are malnourished.
The proportion of malnourished and of starving people in the world has been more or less continually decreasing for at least several centuries. This is due to an increasing supply of food and to overall gains in economic efficiency. In 40 years, the proportion of malnourished people in the developing world has been more than halved. The proportion of starving people has decreased even faster.
Until 2017, worldwide deaths from famine had been falling dramatically. The World Peace Foundation reported that from the 1870s to the 1970s, great famines killed an average of 928,000 people a year. Since 1980, annual deaths had dropped to an average of 75,000, less than 10% of what they had been until the 1970s. That reduction was achieved despite the approximately 150,000 lives lost in the 2011 Somalia famine. Yet in 2017, the UN officially declared famine had returned to Africa, with about 20 million people at risk of death from starvation in Nigeria, in South Sudan, in Yemen, and in Somalia.
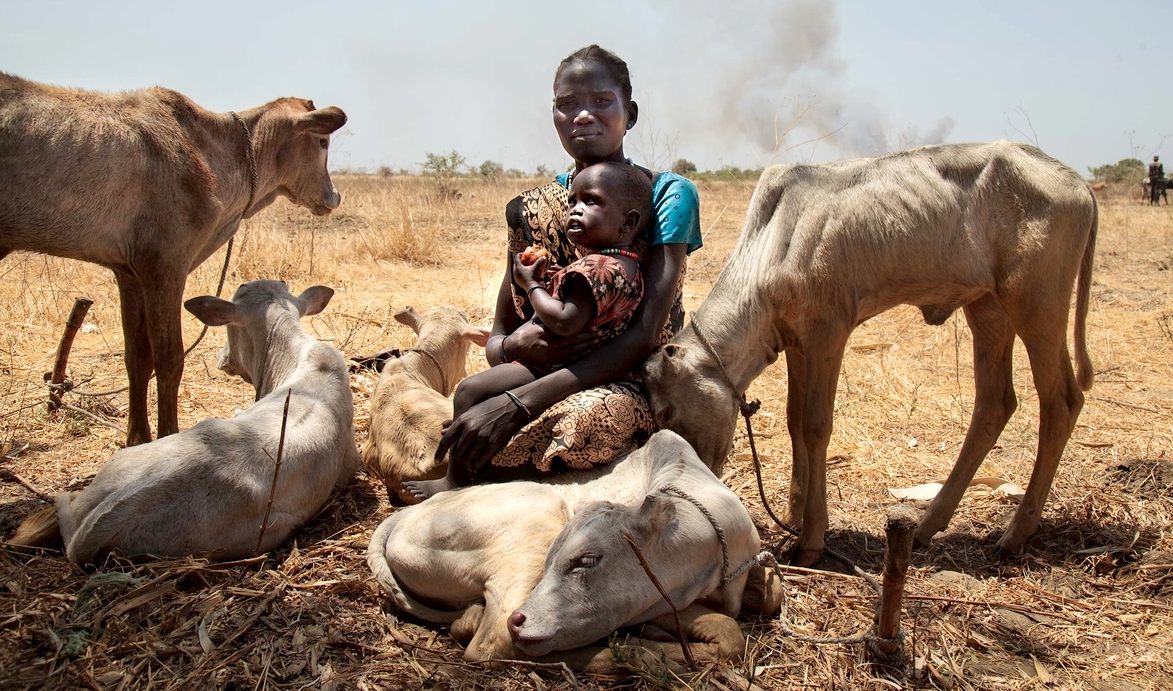
FUTURE RISKS
The Guardian reports that in 2007 approximately 40% of the world's agricultural land is seriously degraded. If current trends of soil degradation continue in Africa, the continent might be able to feed just 25% of its population by 2025, according to UNU's Ghana-based Institute for Natural Resources in Africa. As of late 2007, increased farming for use in biofuels, along with world oil prices at nearly $100 a barrel, has pushed up the price of grain used to feed poultry and dairy cows and other cattle, causing higher prices of wheat (up 58%), soybean (up 32%), and maize (up 11%) over the year. In 2007 Food riots have taken place in many countries across the world. An epidemic of stem rust, which is destructive to wheat and is caused by race Ug99, has in 2007 spread across Africa and into Asia.
Beginning in the 20th century, nitrogen fertilizers, new pesticides, desert farming, and other agricultural technologies began to be used to increase food production, in part to combat famine. Between 1950 and 1984, as the Green Revolution influenced agriculture] world grain production increased by 250%. Developed nations have shared these technologies with developing nations with a famine problem. However, as early as 1995, there were signs that these new developments may contribute to the decline of arable land (e.g. persistence of pesticides leading to soil contamination, salt accumulation due to irrigation, erosion).
In 1994, David Pimentel, professor of ecology and agriculture at Cornell University, and Mario Giampietro, senior researcher at the National Research Institute on Food and Nutrition (INRAN), estimated the maximum U.S. population for a sustainable economy at 200 million.
According to geologist Dale Allen Pfeiffer, coming decades could see rising food prices without relief and massive starvation on a global level. Water deficits, which are already spurring heavy grain imports in numerous smaller countries, may soon do the same in larger countries, such as China or India. The water tables are falling in many countries (including Northern China, the US, and India) due to widespread overconsumption. Other countries affected include Pakistan, Iran, and Mexico. This will eventually lead to water scarcity and cutbacks in grain harvest. Even while overexploiting its aquifers, China has developed a grain deficit, contributing to the upward pressure on grain prices. Most of the three billion people projected to be added worldwide by mid-century will be born in countries already experiencing water shortages.
After China and India, there is a second tier of smaller countries with large water deficits – Algeria, Egypt, Iran, Mexico, and Pakistan. Four of these already import a large share of their grain. Only Pakistan remains marginally self-sufficient. But with a population expanding by 4 million a year, it will also soon turn to the world market for grain.
According to a UN climate report, the Himalayan glaciers that are the principal dry-season water sources of Asia's biggest rivers – Ganges, Indus, Brahmaputra, Yangtze, Mekong, Salween and Yellow – could disappear by 2350 as temperatures rise and human demand rises. Approximately 2.4 billion people live in the drainage basin of the Himalayan rivers. India, China, Pakistan, Afghanistan, Bangladesh, Nepal and Myanmar could experience floods followed by severe droughts in coming decades. In India alone, the Ganges provides water for drinking and farming for more than 500 million people.
Evan Fraser, a geographer at the University of Guelph in Ontario, Canada, explores the ways in which climate change may affect future famines. To do this, he draws on a range of historic cases where relatively small environmental problems triggered famines as a way of creating theoretical links between climate and famine in the future. Drawing on situations as diverse as the Great Irish Potato Famine, a series of weather induced famines in Asia during the late 19th century, and famines in Ethiopia during the 1980s, he concludes there are three "lines of defense" that protect a community's food security from environmental change. The first line of defense is the agro-ecosystem on which food is produced: diverse ecosystems with well managed soils high in organic matter tend to be more resilient. The second line of defense is the wealth and skills of individual households: If those households affected by bad weather such as drought have savings or skills they may be able to do all right despite the bad weather. The final line of defense is created by the formal institutions present in a society. Governments, churches, or NGOs must be willing and able to mount effective relief efforts. Pulling this together, Evan Fraser argues that if an ecosystem is resilient enough, it may be able to withstand weather-related shocks. But if these shocks overwhelm the ecosystem's line of defense, it is necessary for the household to adapt using its skills and savings. If a problem is too big for the family or household, then people must rely on the third line of defense, which is whether or not the formal institutions present in a society are able to provide help. Evan Fraser concludes that in almost every situation where an environmental problem triggered a famine you see a failure in each of these three lines of defense. Hence, understanding how climate change may cause famines in the future requires combining both an assessment of local socio-economic and environmental factors along with climate models that predict where bad weather may occur in the future.
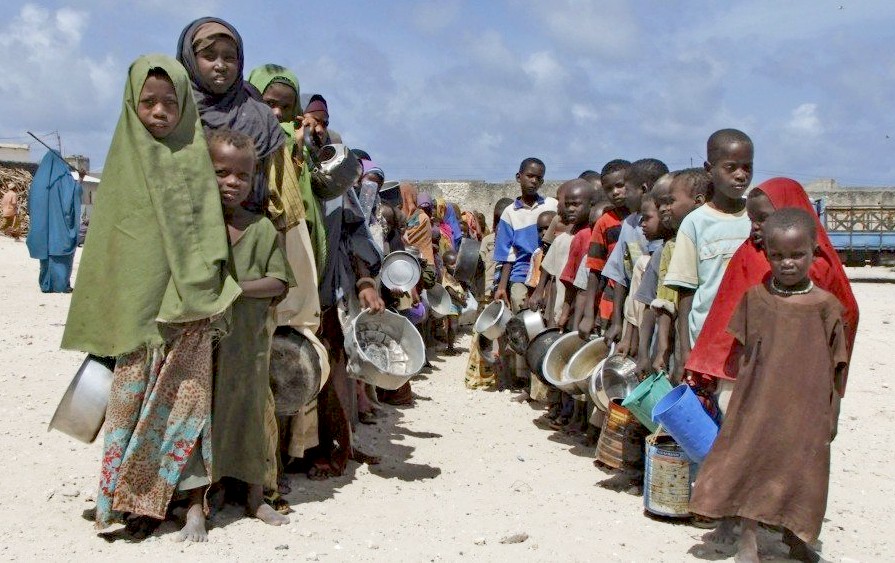
FOOD SECURITY
Long term measures to improve food
security, include investment in modern agriculture techniques, such as fertilizers and irrigation, but can also include strategic national food storage.
World Bank strictures restrict government subsidies for farmers, and increasing use of fertilizers is opposed by some environmental groups because of its unintended consequences: adverse effects on water supplies and habitat.
The effort to bring modern agricultural techniques found in the Western world, such as nitrogen fertilizers and pesticides, to the Indian Sub-continent, called the Green Revolution, resulted in decreases in malnutrition similar to those seen earlier in Western nations. This was possible because of existing infrastructure and institutions that are in short supply in Africa, such as a system of roads or public seed companies that made seeds available. Supporting farmers in areas of food insecurity, through such measures as free or subsidized fertilizers and seeds, increases food harvest and reduces food prices.
The World Bank and some rich nations press nations that depend on them for aid to cut back or eliminate subsidized agricultural inputs such as fertilizer, in the name of privatization even as the United States and Europe extensively subsidized their own farmers.
LEVELS OF FOOD INSECURITY
In modern times, local and political governments and non-governmental organizations that deliver famine relief have limited resources with which to address the multiple situations of food insecurity that are occurring simultaneously. Various methods of categorizing the gradations of food security have thus been used in order to most efficiently allocate food relief. One of the earliest were the Indian Famine Codes devised by the British in the 1880s. The Codes listed three stages of food insecurity: near-scarcity, scarcity and famine, and were highly influential in the creation of subsequent famine warning or measurement systems. The early warning system developed to monitor the region inhabited by the Turkana people in northern Kenya also has three levels, but links each stage to a pre-planned response to mitigate the crisis and prevent its deterioration
The experiences of famine relief organizations throughout the world over the 1980s and 1990s resulted in at least two major developments: the "livelihoods approach" and the increased use of nutrition indicators to determine the severity of a crisis. Individuals and groups in food stressful situations will attempt to cope by rationing consumption, finding alternative means to supplement income, etc., before taking desperate measures, such as selling off plots of agricultural land. When all means of self-support are exhausted, the affected population begins to migrate in search of food or fall victim to outright mass starvation. Famine may thus be viewed partially as a social phenomenon, involving markets, the price of food, and social support structures. A second lesson drawn was the increased use of rapid nutrition assessments, in particular of children, to give a quantitative measure of the famine's severity.
Since 2003, many of the most important organizations in famine relief, such as the World Food Programme and the U.S. Agency for International Development, have adopted a five-level scale measuring intensity and magnitude. The intensity scale uses both livelihoods' measures and measurements of mortality and child malnutrition to categorize a situation as food secure, food insecure, food crisis, famine, severe famine, and extreme famine. The number of deaths determines the magnitude designation, with under 1000 fatalities defining a "minor famine" and a "catastrophic famine" resulting in over 1,000,000 deaths.
BIODIVERSITY
COP HISTORY
|
COP
1: 1994 Nassau, Bahamas,
Nov & Dec
|
COP
8: 2006
Curitiba, Brazil, 8
Mar
|
|
COP
2: 1995 Jakarta, Indonesia,
Nov
|
COP
9: 2008 Bonn, Germany,
May
|
|
COP
3: 1996 Buenos Aires, Argentina,
Nov
|
COP
10: 2010 Nagoya, Japan,
Oct
|
|
COP
4: 1998 Bratislava, Slovakia, May
|
COP
11: 2012
Hyderabad, India
|
|
EXCOP:
1999 Cartagena, Colombia, Feb
|
COP
12: 2014
Pyeongchang, Republic of Korea, Oct
|
|
COP
5: 2000 Nairobi, Kenya, May
|
COP
13: 2016 Cancun, Mexico,
2 to 17 Dec
|
|
COP
6: 2002 The Hague, Netherlands,
April
|
COP
14: 2018
Sharm El-Sheikh, Egypt, 17 to 29 Nov
|
|
COP
7: 2004 Kuala Lumpur, Malaysia, Feb
|
COP
15: 2020 Kunming, Yunnan, China
|
CLIMATE
CHANGE UN COP HISTORY
|
1995
COP 1, BERLIN, GERMANY
1996
COP 2, GENEVA, SWITZERLAND
1997
COP 3, KYOTO, JAPAN
1998
COP 4, BUENOS AIRES, ARGENTINA
1999
COP 5, BONN, GERMANY
2000:COP
6, THE HAGUE, NETHERLANDS
2001
COP 7, MARRAKECH, MOROCCO
2002
COP 8, NEW DELHI, INDIA
2003
COP 9, MILAN, ITALY
2004
COP 10, BUENOS AIRES, ARGENTINA
2005
COP 11/CMP 1, MONTREAL, CANADA
2006
COP 12/CMP 2, NAIROBI, KENYA
2007
COP 13/CMP 3, BALI, INDONESIA
|
2008
COP 14/CMP 4, POZNAN, POLAND
2009
COP 15/CMP 5, COPENHAGEN, DENMARK
2010
COP 16/CMP 6, CANCUN, MEXICO
2011
COP 17/CMP 7, DURBAN, SOUTH AFRICA
2012
COP 18/CMP 8, DOHA, QATAR
2013
COP 19/CMP 9, WARSAW, POLAND
2014
COP 20/CMP 10, LIMA, PERU
2015
COP 21/CMP 11, Paris, France
2016
COP 22/CMP 12/CMA 1, Marrakech, Morocco
2017
COP 23/CMP 13/CMA 2, Bonn, Germany
2018
COP 24/CMP 14/CMA 3, Katowice, Poland
2019
COP 25/CMP 15/CMA 4, Santiago, Chile
2020
COP 26/CMP 16/CMA 5, to be announced
|
DESERTIFICATION
COP HISTORY
|
COP
1:
Rome, Italy, 29 Sept to 10 Oct 1997
|
COP
9:
Buenos Aires, Argentina, 21 Sept to 2 Oct 2009
|
|
COP
2:
Dakar, Senegal, 30 Nov to 11 Dec 1998
|
COP
10:
Changwon, South Korea, 10 to 20 Oct 2011
|
|
COP
3:
Recife, Brazil, 15 to 26 Nov 1999
|
COP
11:
Windhoek, Namibia, 16 to 27 Sept 2013
|
|
COP
4:
Bonn, Germany, 11 to 22 Dec 2000
|
COP
12:
Ankara, Turkey, 12 to 23 Oct 2015
|
|
COP
5:
Geneva, Switzerland, 1 to 12 Oct 2001
|
COP
13:
Ordos City, China, 6 to 16 Sept 2017
|
|
COP
6:
Havana, Cuba, 25 August to 5 Sept 2003
|
COP
14:
New Delhi, India, 2 to 13 Sept 2019
|
|
COP
7:
Nairobi, Kenya, 17 to 28 Oct 2005
|
COP
15:
2020
|
|
COP
8:
Madrid, Spain, 3 to 14 Sept 2007
|
COP
16: 2021
|

LAST
SUPPER
- If we
are not careful your last portion of cod and chips will be the
last safe supper from the ocean. Future portions are likely to
contain a potentially cancerous
death sentence.
LINKS
& REFERENCE
www:
https:
This website is
provided on a free basis as a public information service. copyright © Cleaner
Oceans Foundation Ltd (COFL) (Company
No: 4674774) 2019. Solar
Studios, BN271RF, United Kingdom.
COFL is
a company without share capital.
|


