|
LAURENT LEBRETON
PLEASE USE OUR A-Z INDEX TO NAVIGATE THIS SITE
|
|
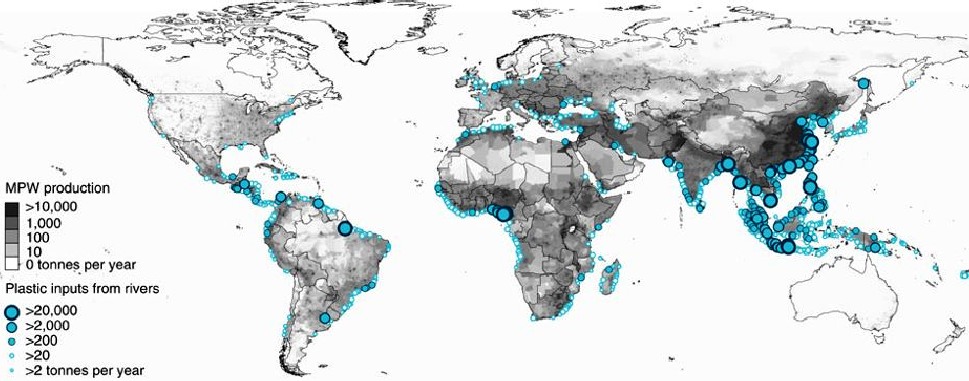
LEBRETON 2017 - Mass of river plastic flowing into oceans in tonnes per year. River contributions are derived from individual watershed characteristics such as population density, mismanaged plastic waste (MPW) production per country and monthly averaged runoff. The model is calibrated against river plastic concentration measurements from Europe, Asia, North and South America.
Laurent
Lebreton MSc is an oceanographer from Raglan, New Zealand now in Wellington.
He was the lead oceanographer for a study by the Ocean Cleanup Foundation and lead author of the study.
LEBRETON, L. C. M. et al. - RIVER PLASTICS EMISSION TO WORLD'S OCEANS JUNE 2017
According to this study the top 20 polluting rivers were mostly located in Asia (Table 1) and accounted for more than two thirds (67%) of the global annual input while covering 2.2% of the continental surface area and representing 21% of the global population.
The top 122 polluting rivers (4% of total landmass surface area and 36% of global population) contributed for >90% of the plastic inputs with 103 rivers located in Asia, eight in Africa, eight in South and Central America, and one in
Europe.
This model predicted that the Chinese Yangtze River is the largest contributing catchment, with an annual input of 0.33 (range 0.31–0.48) million tonnes of plastic discharged into the East China Sea, followed by the Ganges River catchment, between India and Bangladesh, with a computed input of 0.12 (range 0.10–0.17) million tonnes per year.
The combined input of the
Xi,
Dong and
Zhujiang Rivers in
China all flowing into the
South China Sea at the
Pearl River delta, was estimated at 0.106 (range 0.091–0.169) million tonnes per year, placing the greater catchment into third position.
In West Africa particularly, the Cross River with 40,300 (range 33,800–65,100) tonnes per year, the Imo River with 21,500 (range: 17,500–35,100) tonnes per year and the Kwa Ibo River with 11,900 (range: 9,300–20,800) tonnes per year all appeared in the list of the twenty most polluting river catchments.
In South America, we estimated an annual input of 38,900 (range 32,200–63,800) tonnes per year coming from the Amazon River, the largest river on earth by water discharge, with tributaries in Peru, Columbia, Ecuador and Brazil. Also in South America, we predicted a significant contribution from the Magdalena River in Columbia with 16,700 (range 12,900–29,500) tonnes per year entering the Gulf of Mexico.
Lebreton, L. C. M. et al. River plastic emissions to the world’s oceans. Nat. Commun. 8, 15611 doi: 10.1038/ncomms15611 (2017).
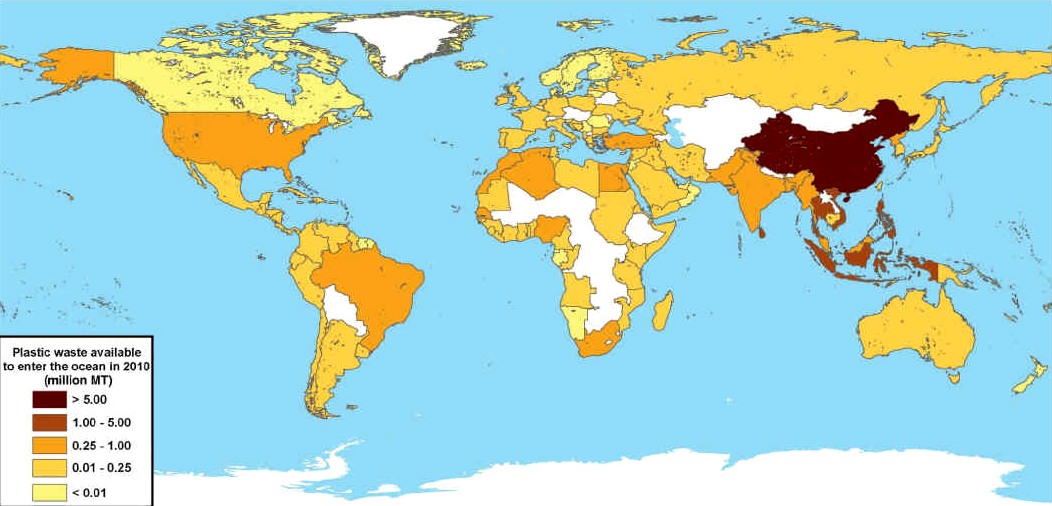
JAMBECK 2010 - Global map with each country shaded according to the estimated mass of mismanaged plastic waste [millions of metric tons (MT)] generated in 2010 by populations living within 50 km of the coast. 192 countries were considered. Countries not included in the study are shaded white.
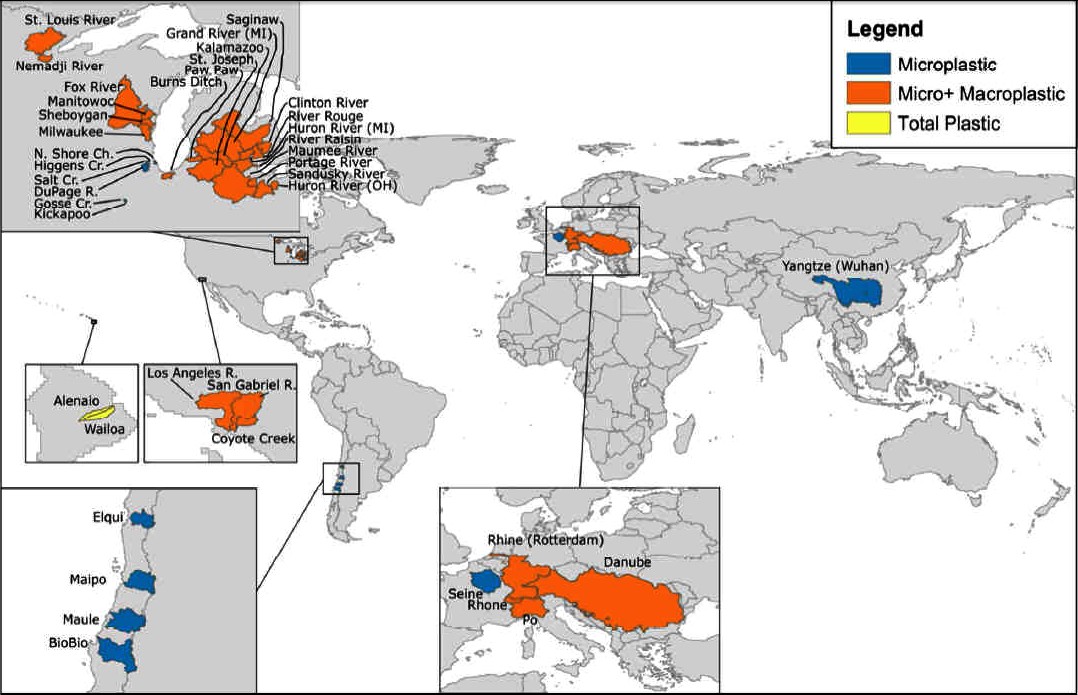
SCHMIDT OCT 2017 - A substantial fraction of marine plastic debris originates from land-based sources. Rivers potentially act as a major transport pathway for all sizes of plastic debris.
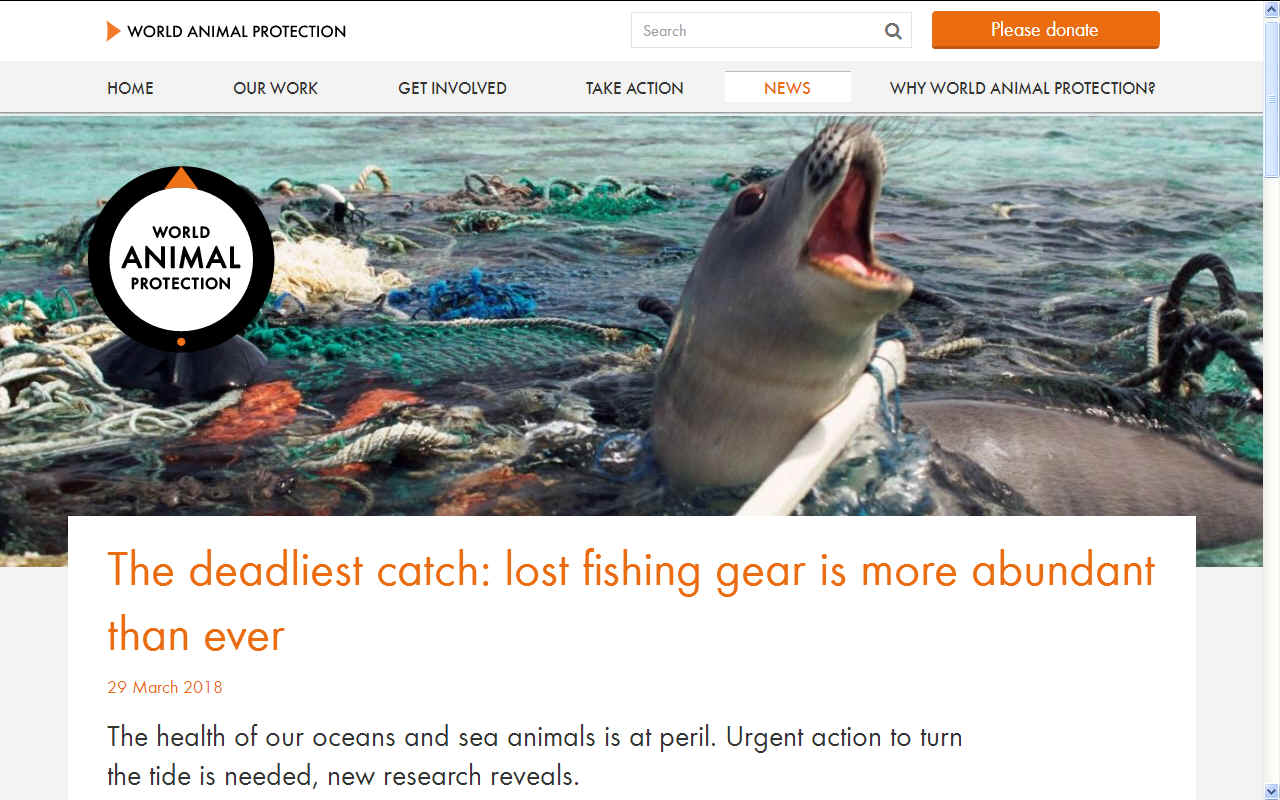
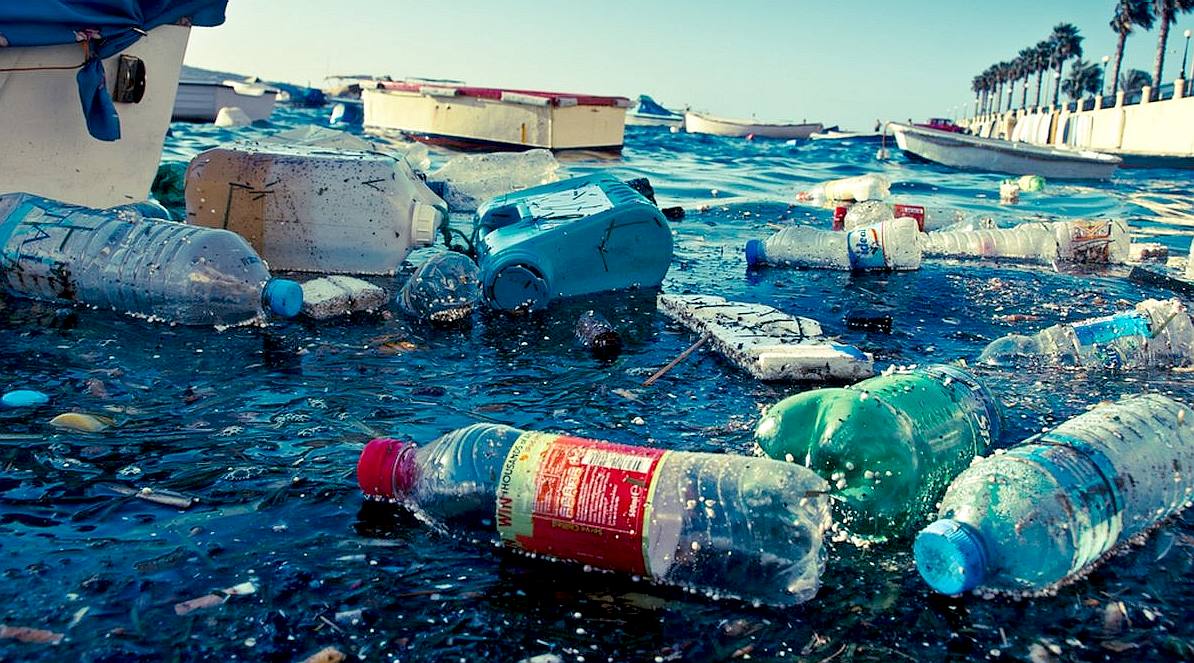
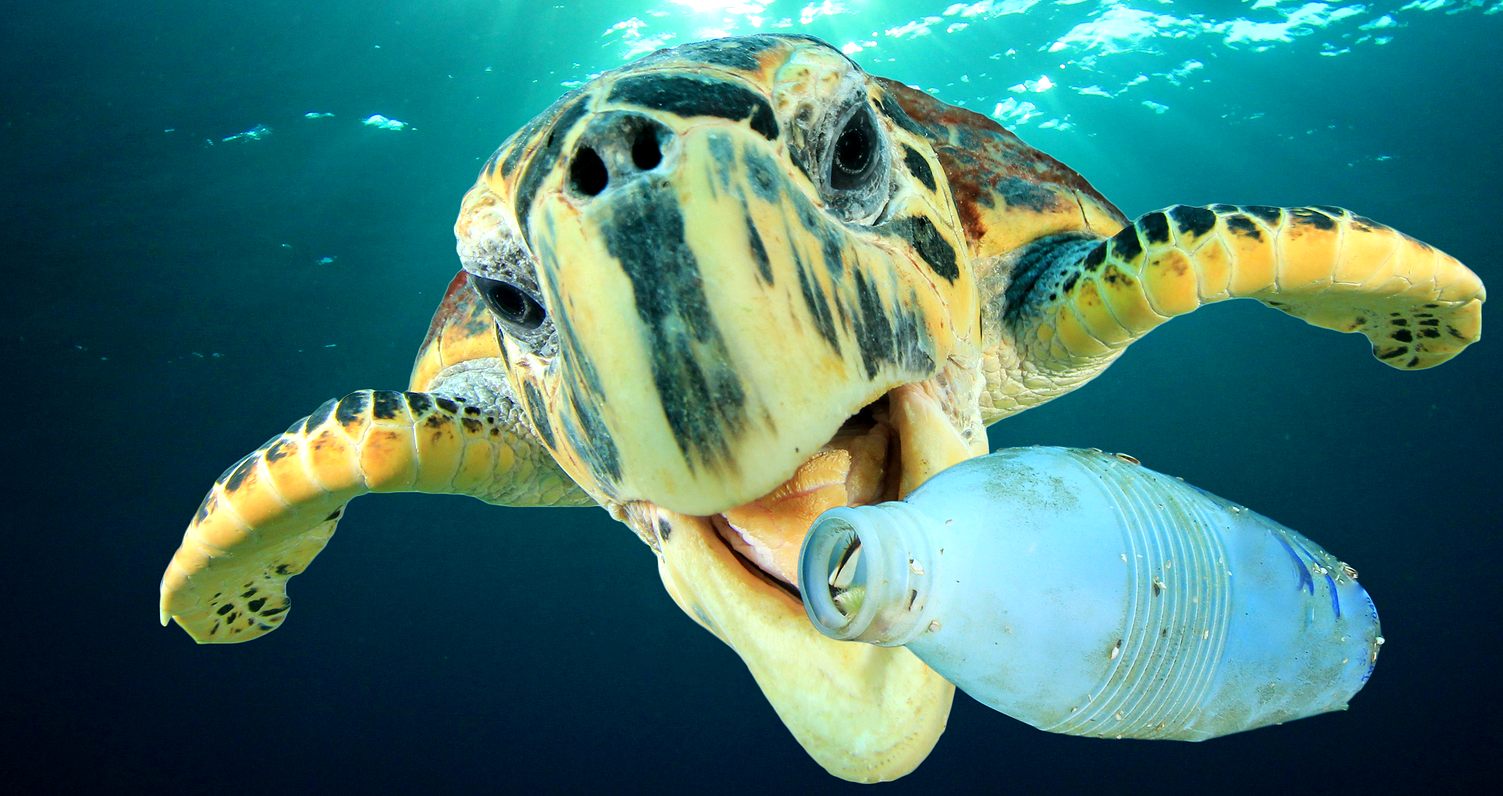
FAST FOOD SLOW RECOVERY - If we all work together we can significantly impact on scenes like this. We have been enjoying the benefits of plastic without ensuring that this durable medium does not unduly affect marine life. Unfortunately, retrospective measures will take longer to achieve equilibrium, but we must act now if we want to prevent more plastic than fish in the sea by 2050. Fortunately, many of the top producers are now looking at circularizing with a view to preventing ocean waste, such as the Alliance to End Plastic Waste.
LINKS & REFERENCE
https://www.worldanimalprotection.org.nz/news/deadliest-catch-lost-fishing-gear-more-abundant-ever https://www.sciencealert.com/great-pacific-garbage-patch-increased-16-times-what-does-look-like https://tt.linkedin.com/in/laurent-lebreton-68365666
|
|
|
ABS - BIOMAGNIFICATION - CANCER - CARRIER BAGS - COTTON BUDS - DDT - FISHING NETS - HEAVY METALS - MARINE LITTER - MICROBEADS MICRO PLASTICS - NYLON - OCEAN GYRES - OCEAN WASTE - PACKAGING - PCBS - PET - PETROLEUM - PLASTIC - PLASTICS - POLYCARBONATE POLYOLEFINS - POLYPROPYLENE - POLYSTYRENE - POLYTHENE - POPS - PVC - SHOES - SINGLE USE - SOUP - STRAWS - WATER
PLEASE USE OUR A-Z INDEX TO NAVIGATE THIS SITE
|
|
|
This website is provided on a free basis as a public information service. copyright © Cleaner Oceans Foundation Ltd (COFL) (Company No: 4674774) 2019. Solar Studios, BN271RF, United Kingdom. COFL is a company without share capital.
|